

Calculated Metrics in GA4 are nothing new – they existed in Universal Analytics too – but they are one of the most under-utilised features. Although you only get five Calculated Metrics in a free property, they are a hugely powerful in making Google Analytics more actionable, particularly for Ecommerce brands.
What are Calculated Metrics?
These are metrics that you build within the Google Analytics interface, using both standard metrics and custom metrics (also an under-utilised feature!). As these are calculated using existing metrics, the Calculated Metric you build is immediately available, so it effectively works retroactively too.
We’ll get into the use cases in a moment, but if you’re already taking metrics out of Google Analytics to create a percentage, or weight them, this is a great solution. Things like item-level margin, item-level add to cart or purchase rate metrics or item discount percentage are all great use cases.
What else do I need to know?
Handily, building Calculated Metrics are pretty simple. But key details are:
- To create a Calculated Metric, you need to be an Editor or Admin on the property
- They are found in Settings > Data Display > Custom Definitions. Within that screen, you have Calculated Metrics as one of the options to select at the top.
- When click to “Create Calculated Metric”, a pane pops out and asks you to name it, optionally give it a description, then build the formula. You start typing and you’ll see a list of metrics available to use. You can combine these using all of the standard selectors (plus, minus, multiply, divide) and then you choose the unit of measurement.
- In a standard, or free, property, you can have up to 5 Calculated Metrics, whilst for Premium, or paid-for, properties, this limit is 50.
- Every metric created, is also available to be queried via the Data API, and the screen here shows you what that is
Great, show me some examples, and what I need to know!
For ecommerce brands, a sorely missing metric is add-to-cart rate. Namely, of all the times a product is viewed, how often is it added to cart. Or bought: you could create item-level purchase rate.
To build a view of add-to-cart rate, there are two options:
First, separate this by PDPs, and elsewhere (mainly PLPs).
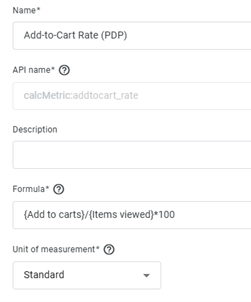
To build this Calculated Metric, you’ll be using, in plain English, “add to carts, divided by product views”. As a user is generally only viewing products on PDPs if you do it this way, it’s really giving you the PDP add-to-cart rate (because you are using the GA4 event called “view_item”). The formula for this would look like:
Add to Carts / Items Viewed * 100
But naturally, users can add-to-cart from elsewhere on the site – typically PLPs, search results pages, carts or other merchandising slots. When these are shown, the metric is Items Viewed In List (because you are using the GA4 event called view_item_list). The formula for this would look like:
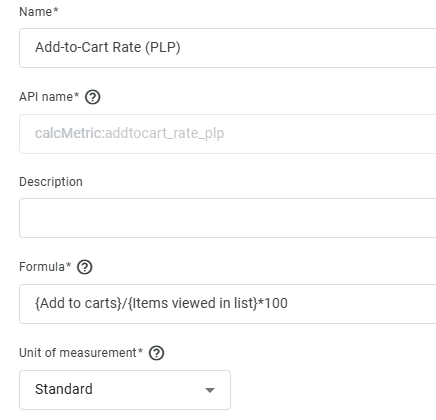
As you can see, this is effectively giving you the PLP add-to-cart rate. For both formulas above, note that you are creating this calculation based on all add to carts. For example, in the last formula we built, we're looking at all add to carts and dividing by all items viewed in list. That means if a user sees a product on a PLP, doesn't add to cart, clicks through to PDP and then adds to cart, it would counts as an Add to Cart for this PLP focused metric - even though the action took place on the PDP.
You can then build an Exploration using these metrics, either to see what the aggregate figures are, what they look like charted over time, or split by Item or page path. You can see an example from the Google Merchandise Site here:
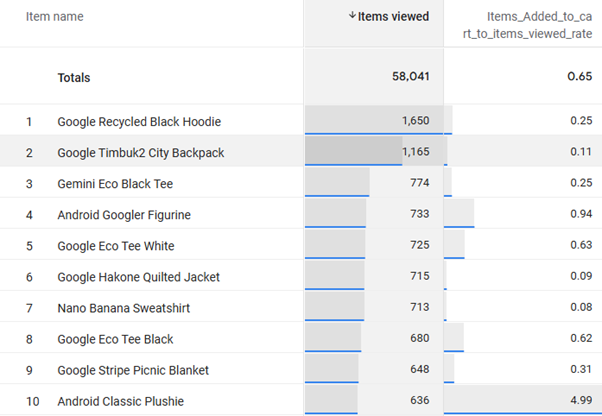
Way to go, Android Classic Plushie.
All this to say - you're second option is to create a single metric, if you would prefer to see what the overall add-to-cart rate looks like. It would look like:
{Add to carts}/({Items viewed in list}+{Items viewed})*100
This effectively negates the issue of using all Add to Carts in the individual formulas above.
Note the difference between item-scoped and session-scoped dimensions
A really, really important distinction to make is the difference between very similarly named dimensions, that won’t quite give you what you’re expecting. In this instance, within Calculated Metrics:
- Add to Carts – refers to how many times a user added an item to their cart. This is what you’ll want most of the time if building these Calculated Metrics and is queryable against, page-based dimensions. You can create an Exploration with Path Path and Screen Class and then filter for PDPs, PLPs or other pages where you can add to cart - and this gives you what you would expect.
- Items Added to Cart – refers to how many of those items were added to cart. So if I add two Android Classic Plushie’s to my cart – that’s one add to cart but two items added to cart. If you use this metric in your Calculated Metric, you’ll be getting a slightly different metric. This is queryable against Item-level dimensions like Item, Item Brand or Item Category and has that caveat that you are looking at ALL add to carts and adding two items to your cart at the same time.
- You can see the difference between these two metrics by just adding them to an Exploration – again below is the difference on the Google Merchandise site across 30 days:
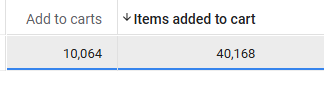
The difference is pretty stark!
Summary
There are tons of things that you can do with Calculated Metrics, and it’s well worth reviewing what is useful for you. Even if you’re saving the process of exporting data to create the calculation in Excel, Sheets or BigQuery, it’s a great idea that allows for speedier analysis.
And let us know if you need anything help!
You may also be interested in

