
Data analysis to drive experimentation
Data is central to our experimentation process, which makes this step all the more significant. The data we collect and analyse fuels the hypotheses of the tests we formulate for optimisation. We have seen that data driven experiments are more likely to provide statistically significant results so mastering this step is key to a fruitful experimentation program.
Data sources for CRO analysis
Understanding which data sources you have access to and what kinds of data they provide is the first step in this process. The north star is to have as many data sources as possible to give us a richer set of insights and a 360 view of user behaviour.
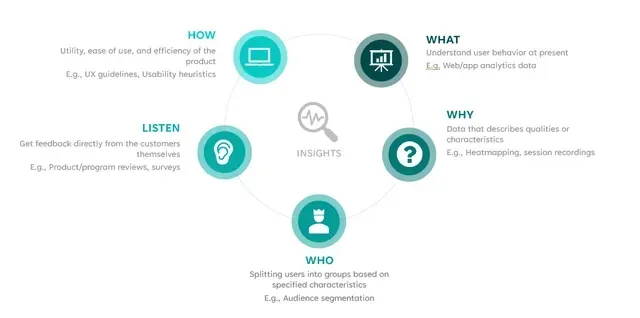
The 'What'
This centers around understanding the user behavior and what is happening on your website or app. This data generally takes a quantitative format and be found through web/app analytics data from sources like Google Analytics, Adobe analytics or Mixpanel.
The 'Why'
This is more descriptive data that outlines qualities and characteristics of user behavior - it helps us understand why we are seeing the behaviour. This generally takes a qualitative format and can be found in things like Heatmaps and Session Recordings in tools like Hotjar and Contentsquare.
The 'Who'
Gaining deeper insight includes segmentation where we split users into groups based on specific characteristics. This leads to you collecting insights about certain types of users, which can inform specific optimisation needs for different cohorts.
Not sure where to start? Here are four types of segmentation to consider:
- Behavioral Segmentation - Is there a difference between your new or returning users? Or based on the pages they view or products they view?
- Technical Segmentation - Is there a difference in behaviour or performance by devices?
- Contextual Segmentation - Does the users location impact performance? Does behaviour differ by time of day or day of week?
- Business specific Segmentation - Are there subsets of users that are important to your business? Is there levels of loyalty we should consider? Brand or product differentiation?
The 'Listen'
Getting insight into what your audience is thinking and saying straight from the source can be powerful. We can gain this using customer reviews, survey responses, call centres enquiries, social media - you name it, we'll use it!
The 'How'
Think about how you might improve the experience or how you might solve a problem the user is having. Consider resources like Jakob Nielsens Usability Heuristics, Cognitive Biases, Research, and UX guidelines.
Mapping the questions you want the data to answer
Once you have a good idea of the data sources at your disposal, mapping specific questions you want to answer will provide clarity of purpose, ensures relevance and efficiency, promotes insightful analysis, mitigates bias, supports iterative improvement, and facilitates communication and collaboration.
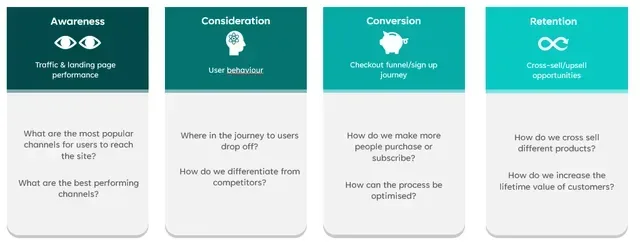
The questions can be grouped whatever way works best for you but a popular structure amongst our clients is to focus on the funnel. For example:
- Awareness - focuses on the traffic and landing page performance
- Consideration - focuses on user behavior and interactions
- Conversion - focuses on the checkout funnel/sign up journey
- Retention - focuses on upsell/cross sell opportunities and increasing the lifetime value of customers.
Once the questions in the Analysis Brief are discussed and finalised its time to start gathering the data. The answers to these questions are what lead to the insights that we can use to build and formalise our hypotheses. Don't forget to consider segmentation and how to best visualise the data to make it clear and easy to understand which areas need to be optimised for which users.
You may also be interested in


E-E-A-T metrics, and why they're so important for GEO
We're all familiar with what eating means in our day-to-day lives, but what does EEAT have to do with SEO...?